Author: Med Yacoub

  • Hedging with Options: Protecting Your Portfolio from Market Volatility

    Hedging with Options: Protecting Your Portfolio from Market Volatility

    This is where options hedging comes into play. Options provide a flexible way to minimize downside risk while maintaining upside potential. This guide will explain how options can be used as a hedge and introduce five essential hedging strategies every investor should know.

    Why Use Options for Hedging?

    Hedging with options allows investors to protect their portfolio against price declines while keeping their core investments intact. Unlike selling stocks outright (which can trigger taxes or remove exposure to future gains), options let investors maintain positions while offsetting potential losses.

    Key Benefits of Hedging with Options

    • Downside Protection: Reduce exposure to large losses without selling assets.
    • Flexibility: Options allow partial or full hedging depending on risk tolerance.
    • Cost Efficiency: Options are often cheaper than liquidating positions and repurchasing them later.
    • Leverage: Small investments in options can provide substantial protection against losses.

    1. Protective Puts: The Insurance Policy for Your Stocks

    A protective put is one of the simplest and most effective ways to hedge a stock or portfolio. It functions like insurance, allowing investors to lock in a minimum selling price while maintaining upside potential.

    How It Works

    A protective put involves buying a put option for a stock or index you own. This gives you the right to sell the asset at a predetermined price (strike price), ensuring you don’t suffer excessive losses if the market drops.

    Example: If you own 100 shares of XYZ stock at $100 per share, you can buy a put option with a strike price of $95 for a small premium. If XYZ falls to $80, your put option allows you to sell at $95, reducing losses.

    Advantages and Considerations

    Protective puts offer strong downside protection but come at a cost—the premium paid. The challenge is balancing the cost of protection against the likelihood of needing it. Investors typically use protective puts before earnings reports, economic releases, or periods of market uncertainty.

    2. Covered Calls: Hedging While Generating Income

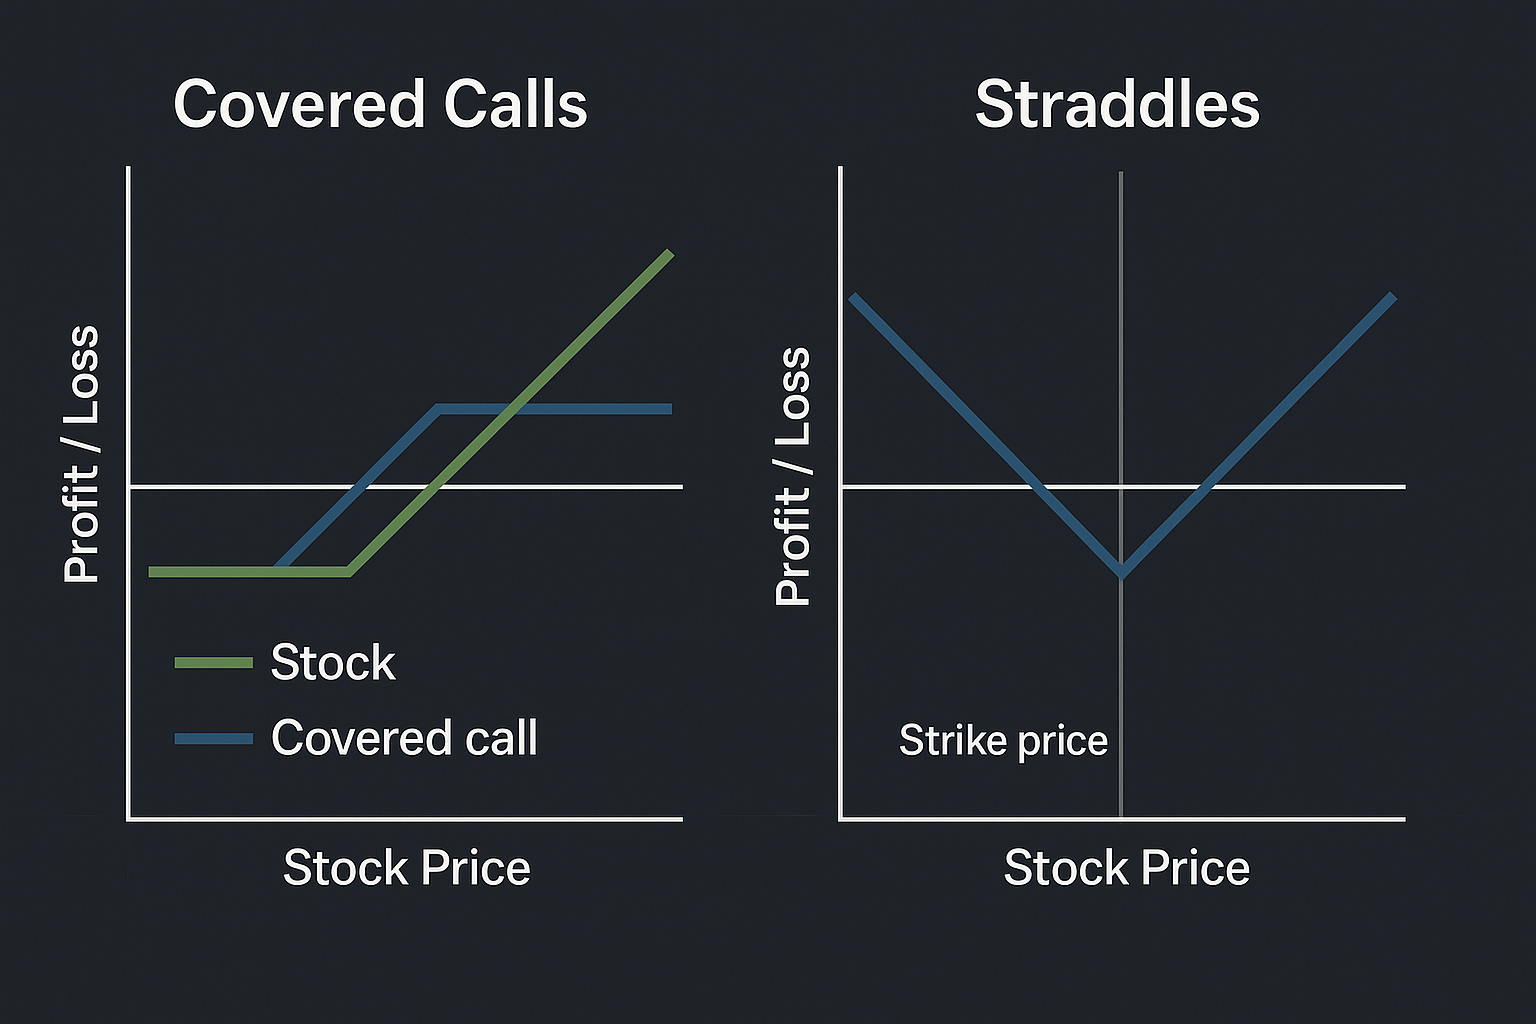
    A covered call is a hedging strategy that also generates extra income. It involves selling a call option against stocks you own, collecting a premium while agreeing to sell the stock if it reaches the strike price.

    How It Works

    If you own 100 shares of ABC stock at $50, you can sell a call option with a strike price of $55 for $2 per share. If ABC stays below $55, you keep both your stock and the $200 premium (100 shares × $2). If ABC rises above $55, you must sell at that price but still keep the premium.

    Advantages and Risks

    Covered calls allow investors to earn extra income while holding their stocks, but they limit potential upside. If the stock price rises sharply beyond the strike price, you may miss out on larger gains. This strategy is best for investors who are neutral to moderately bullish on a stock.

    3. Collars: Limiting Risk with Minimal Cost

    A collar strategy combines a protective put and a covered call to hedge a stock position with minimal cost. It protects against significant losses without requiring a large premium payment.

    How It Works

    If you own 100 shares of XYZ at $100, you could:

    • Buy a $95 put (protects against a drop below $95)
    • Sell a $110 call (caps gains at $110 but reduces put costs)

    By selling the call, the investor reduces the cost of the protective put, making it an affordable hedge. This strategy is especially useful during market uncertainty when an investor wants protection but also wants to avoid paying high option premiums.

    When to Use a Collar Strategy

    Collars are useful when investors want low-cost downside protection while maintaining long-term exposure to a stock. They are particularly effective when markets are volatile and options premiums are expensive.

    4. Index Puts: Hedging a Portfolio Against Market Crashes

    For investors holding diversified portfolios, buying index puts can provide broad market protection without needing to hedge each stock individually.

    How It Works

    Buying put options on major indices like the S&P 500 (SPX) or Nasdaq (NDX) allows investors to hedge against a general market decline. If the market falls, index puts increase in value, helping offset portfolio losses.

    Example: If your portfolio closely follows the S&P 500, buying SPX put options allows you to hedge against a market downturn without selling individual stocks.

    Best Use Cases

    • During bear markets or recessions
    • As a hedge against broad-based declines
    • When holding a diversified portfolio but needing short-term protection

    5. Ratio Put Spreads: Cost-Effective Downside Protection

    A ratio put spread is a more advanced hedging strategy that provides limited downside protection at a reduced cost. It involves buying one put option and selling multiple lower-strike puts to offset the cost.

    How It Works

    If XYZ trades at $100, you could:

    • Buy a $95 put
    • Sell two $90 puts

    This creates a hedge at a lower cost but does not fully protect against extreme declines. The risk increases if the stock falls far below the lower strike price.

    Ideal Scenarios for Ratio Put Spreads

    Ratio put spreads work best when traders expect minor declines rather than a full market crash. They help reduce hedging costs while still providing some downside protection.

    Options Strategy Comparison

    Strategy Typical Cost Downside Protection
    Long Call High Low
    Covered Call Low Low
    Protective Put Moderate High
    Vertical Spread Moderate Moderate
    Iron Condor Low Moderate

    Conclusion

    Hedging with options provides a strategic way to manage portfolio risk without liquidating investments. Strategies like protective puts, covered calls, collars, and index puts allow investors to protect against losses while maintaining long-term growth potential.

    Each strategy has its own risk-reward tradeoffs, so choosing the right approach depends on market conditions, risk tolerance, and investment goals. For best results, investors should consider combining these techniques or adjusting their hedges based on market outlook.


    Learn More

    Want to learn more about hedging strategies?
    Explore Tradesk’s educational resources for more insights into risk management and options trading.

  • Taking Options to the Next Level: Mastering Covered Calls, Straddles, and Other Advanced Strategies

    Taking Options to the Next Level: Mastering Covered Calls, Straddles, and Other Advanced Strategies

    This guide will introduce you to some of the most powerful options strategies, including covered calls, straddles, iron condors, and spreads, helping you take your trading game to the next level. Understanding these strategies allows traders to adapt to different market conditions, whether they expect high volatility, stable price movements, or slow upward trends.

    Why Trade Advanced Options Strategies?
    Before diving into specific strategies, it’s essential to understand why traders use advanced options trading techniques:

    • Enhanced Risk Management: Options strategies can hedge against market downturns and limit losses by mitigating exposure to market swings.
    • Higher Income Potential: Selling options premiums, such as with covered calls and cash-secured puts, generates steady income for traders looking for additional revenue streams.
    • Increased Market Flexibility: Strategies like straddles and condors allow traders to profit in volatile and non-directional markets, maximizing gains in different scenarios.
    • Leverage with Controlled Risk: Compared to buying stocks outright, options allow traders to control large positions with smaller capital, enhancing efficiency.

    Now, let’s explore some of the most effective advanced options trading strategies and how they can be implemented effectively.

    Explore More: New to options trading? Check out these beginner guides:

    1. Covered Calls: Generating Income on Your Holdings

    A covered call is an income-generating strategy where a trader sells a call option against a stock they already own. This allows the investor to collect a premium while limiting upside potential.

    How it Works:

    • The trader owns 100 shares of a stock.
    • They sell a call option at a strike price above the current stock price.
    • If the stock remains below the strike price, the trader keeps the premium and retains their shares.
    • If the stock rises above the strike price, the shares are called away, and the trader earns both the premium and the stock’s price appreciation up to the strike price.

    Best Use Case:

    • Ideal for investors looking to generate passive income from their stock holdings while minimizing risk.
    • Works best in neutral to slightly bullish markets, where stock appreciation is expected but limited.
    • Used by long-term investors who want to profit from stocks they already own while reducing downside risk.

    2. Straddles: Profiting from Volatility

    A straddle is a market-neutral strategy that profits from large price swings in either direction. This strategy is particularly useful when traders expect a significant price movement but are uncertain about its direction.

    How it Works:

    • The trader buys both a call and a put option with the same strike price and expiration date.
    • If the stock moves significantly up or down, one of the options will gain enough value to offset losses on the other.
    • The strategy works best when expecting big price movements, such as before earnings announcements or economic reports.

    Understanding the types of options is key here, as each option contract behaves differently in volatile conditions.

    Best Use Case:

    • When expecting high volatility, but uncertain about price direction.
    • Ideal for earnings season, Federal Reserve rate decisions, or major company announcements.
    • Works well when implied volatility is low, allowing traders to purchase options at a lower premium before a price breakout.

    3. Iron Condors: Profiting in Low-Volatility Markets

    An iron condor is a low-risk, limited-reward strategy that profits when a stock stays within a certain price range. This strategy is ideal for traders who expect little movement in the underlying stock.

    How it Works:

    • The trader sells both a put spread and a call spread.
    • This creates a range in which maximum profit is achieved if the stock remains between the two short strikes.
    • Losses are capped if the stock moves beyond the long options’ strike prices.

    Best Use Case:

    • Ideal for low-volatility markets, where stocks trade within a range.
    • Often used in sideways or consolidating markets where no clear trend is forming.
    • Works well with index ETFs or stable blue-chip stocks with predictable price ranges.

    4. Debit & Credit Spreads: Balancing Risk and Reward

    Debit Spread (Bull Call Spread / Bear Put Spread)
    A debit spread is a directional strategy where traders buy an option and simultaneously sell another option at a different strike price to reduce the trade’s cost.

    Example:

    • Bull Call Spread: Buy a lower strike call, sell a higher strike call (used in bullish markets).
    • Bear Put Spread: Buy a higher strike put, sell a lower strike put (used in bearish markets).

    Credit Spread (Bull Put Spread / Bear Call Spread)
    A credit spread generates income upfront by selling a higher-premium option and buying a lower-premium option.

    Example:

    • Bull Put Spread: Sell a higher strike put, buy a lower strike put (used in bullish markets).
    • Bear Call Spread: Sell a lower strike call, buy a higher strike call (used in bearish markets).

    Best Use Case:

    • Debit spreads: When expecting a stock to move directionally with controlled risk.
    • Credit spreads: When expecting a stock to stay within a range, generating income while limiting downside risk.

    5. Calendar Spreads: Playing with Time Decay

    A calendar spread involves buying a longer-term option while simultaneously selling a shorter-term option with the same strike price. This strategy takes advantage of time decay differences between short-term and long-term options.

    How it Works:

    • Traders benefit from greater time decay on the short-term option while holding a long-term position.
    • If implied volatility increases near the short-term expiration, the spread gains value.

    Best Use Case:

    • When expecting steady price movement with increasing volatility.
    • Works well around earnings reports, macroeconomic news, and industry trends where volatility increases over time.

    Conclusion
    Mastering advanced options strategies can take your trading to the next level, allowing you to generate consistent income, manage risk effectively, and profit from volatility.

    Whether you’re using covered calls for passive income, straddles for volatility plays, or iron condors for range-bound markets, these strategies provide an edge in various market conditions. Understanding the right environment for each strategy ensures traders can maximize their risk-adjusted returns.

    To see how to put these ideas into action, check out how to place an options trade using the Tradesk platform, and review when you can trade options to make sure you’re ready to go.

    Want to learn more? Explore Tradesk’s educational resources and start implementing advanced options strategies today.

  • How to Read a Stock Chart: A Beginner’s Guide to Stock Chart Analysis

    How to Read a Stock Chart: A Beginner’s Guide to Stock Chart Analysis

    But don’t worry stock charts aren’t as complicated as they look! Once you understand the basics, you’ll be able to analyze price movements, identify trends, and make more informed investment decisions. This guide will walk you through the essential elements of a stock chart and help you start using charts to your advantage.

    Tradesk’s advanced charting tools make it easy to visualize price trends, volume spikes, and technical indicators all in one seamless interface. Use this guide alongside the app to sharpen your skills.

    What Is a Stock Chart?

    A stock chart is a graphical representation of a stock’s price movements over a specific period. It allows traders and investors to analyze historical performance, spot trends, and predict potential future movements.

    Why Are Stock Charts Important?

    Stock charts serve as essential tools for investors and traders alike. They help market participants gauge stock performance, identify buy or sell opportunities, and recognize key price levels.

    • Identify Trends – Charts help determine if a stock is in an uptrend, downtrend, or moving sideways.
    • Understand Price Movements – Analyzing past price action can help predict future movements.
    • Support Trading Decisions – Traders use stock charts to decide when to buy or sell based on price patterns and technical indicators.
    • Evaluate Market Sentiment – Stock charts often reflect investor psychology, fear, and greed, which influence price action.

    Key Components of a Stock Chart

    1. Time Frame

    Stock charts display price data over different time frames. Understanding these time frames is crucial because different investors and traders analyze charts based on their investment horizon.

    • Intraday (1-minute, 5-minute, 15-minute) – Used for short-term trading and day traders looking for quick gains.
    • Daily or Weekly – Common for swing traders and long-term investors analyzing medium-term trends.
    • Monthly or Yearly – Helps investors assess long-term price action and identify macro trends in the stock’s performance.

    2. Price Movements

    Stock charts visually represent the fluctuation of stock prices over time. Price movements can be displayed using different types of charts:

    • Line Chart – A simple chart that connects closing prices over time, useful for identifying overall trends.
    • Bar Chart – Displays opening, closing, high, and low prices for each time period, providing more detail than line charts.
    • Candlestick Chart – The most popular chart type, showing detailed price movements with green (up) and red (down) candlesticks. This chart type provides the most visual insights into stock price action.

    3. Volume

    • Volume represents the number of shares traded during a specific period. High volume typically indicates strong interest in a stock, while low volume may suggest weak market participation.
    • A sudden increase in volume can signal a major price move, either up or down. Volume spikes are often associated with earnings releases, major news, or significant institutional buying and selling.

    4. Support and Resistance Levels

    • Support: A price level where a stock tends to stop falling and bounce back up due to buying pressure.
    • Resistance: A price level where a stock struggles to rise above and often reverses downward due to selling pressure.
    • Breakouts: When a stock moves above resistance or below support, it can indicate the start of a new trend.

    Understanding support and resistance helps investors predict potential entry and exit points.

    Advanced Stock Chart Analysis

    1. Trendlines and Channels

    Trendlines are straight lines drawn on a chart to connect price points. These lines help investors visually identify trends and potential reversal points.

    • Uptrend Line: Drawn by connecting higher lows, indicating continued upward movement.
    • Downtrend Line: Drawn by connecting lower highs, suggesting downward movement.
    • Channels: Formed when two parallel trendlines contain price movement, helping traders predict breakouts.

    2. Candlestick Patterns

    Candlestick patterns provide insights into market sentiment and potential reversals. Some key patterns include:

    • Doji: Indicates indecision in the market; can signal a trend reversal.
    • Hammer and Hanging Man: Suggests potential reversals based on price rejections.
    • Engulfing Patterns: Bullish or bearish reversals signaled by a larger candle engulfing a previous one.
    • Morning Star and Evening Star: Three-candle reversal patterns signaling bullish or bearish momentum.

    3. Fibonacci Retracement

    Fibonacci retracement is a technical tool used to identify support and resistance levels based on mathematical ratios.

    • Common retracement levels: 23.6%, 38.2%, 50%, 61.8%, and 78.6%.
    • Helps traders anticipate potential reversal zones where a stock may bounce or consolidate.

    Technical Indicators to Use With Stock Charts

    1. Relative Strength Index (RSI)

    RSI measures the strength of a stock’s price movement on a scale from 0 to 100.

    • Above 70: The stock may be overbought (due for a pullback).
    • Below 30: The stock may be oversold (potential buying opportunity).

    2. Moving Average Convergence Divergence (MACD)

    MACD is a momentum indicator that helps identify trend reversals.

    • When the MACD line crosses above the signal line, it suggests a buy signal.
    • When the MACD line crosses below the signal line, it suggests a sell signal.

    3. Bollinger Bands

    Bollinger Bands consist of three lines (upper, middle, and lower bands) that help identify volatility and potential price breakouts.

    • Price near the upper band: Stock may be overbought.
    • Price near the lower band: Stock may be oversold.

    Conclusion

    Reading stock charts is an essential skill for any investor. By understanding price movements, volume trends, and technical indicators, you can make informed trading decisions and better navigate the stock market.

    For those looking to dive deeper into stock analysis, mastering advanced concepts such as trendlines, Fibonacci retracements, and candlestick patterns can further enhance trading accuracy.

    If you’re ready to start analyzing stocks, explore Tradesk’s advanced charting tools and take control of your investing journey!


    Looking for more investing insights? Check out our other beginner friendly guides on understanding market trends and how to place your first trade.

  • Stay Ahead with Insider Trades: How to Monitor Insider Trading Activity for Smarter Investing

    Stay Ahead with Insider Trades: How to Monitor Insider Trading Activity for Smarter Investing

    When top executives and key stakeholders buy or sell shares of their own company, it can provide valuable clues about the company’s financial health and future prospects. Insider trading activity the buying and selling of stock by corporate executives, board members, and key employees—often reflects confidence or concern about a company’s future performance.

    By tracking insider transactions, investors can gain an edge in understanding stock movements and refining their strategies.

    Tradesk now makes this easier than ever. Our platform’s built in Insider Trades feature gives investors a real time, visual breakdown of executive transactions so you can act on what the market’s decision makers are doing, not just what they’re saying.

    By tracking insider transactions, investors can gain an edge in understanding stock movements and refining their investment strategies. This guide will explain what insider trading is, how to track it, and how to use this information to make smarter investment decisions.

    What is Insider Trading?

    Legal vs. Illegal Insider Trading

    Insider trading refers to the buying or selling of stocks by company insiders. There are two types:

    • Legal Insider Trading: When corporate executives and employees buy or sell stock while properly reporting their transactions to regulatory agencies, such as the SEC.
    • Illegal Insider Trading: When insiders trade stocks based on material nonpublic information (such as upcoming earnings reports, mergers, or regulatory approvals) before it is disclosed to the public.

    Understanding the difference is crucial, as illegal insider trading carries severe penalties, while legal insider trading can provide valuable insights for investors.

    Why Insider Trades Matter to Investors

    Executives and directors have deep knowledge of their company’s financial health and future prospects. Their buying and selling activity can serve as a signal for investors:

    • Insider Buying: Often suggests confidence in the company’s future growth or undervaluation.
    • Insider Selling: Could indicate concerns about the company’s stock price, upcoming challenges, or an overvalued market position.

    It’s important to analyze these trades in context, as some executives may sell shares for personal financial reasons unrelated to the company’s outlook.

    How Real Time Insider Trade Tracking Works
    With Tradesk’s insider trade tracking, users can view trades to track specific companies, industries, or individual executives. The tool presents clear visualizations of insider activity, allowing users to spot trends, analyze patterns, and integrate this data into their market strategy. By observing what executives and board members are doing with their own shares, investors gain insights into a company’s potential trajectory, often months before results become publicly apparent.

    How to Track Insider Trading Activity

    Investors can monitor insider trades through publicly available data. In the U.S., the Securities and Exchange Commission (SEC) requires insiders to report trades via Form 4 filings.

    1. Understanding SEC Form 4 Filings

    Form 4 is a document that insiders must file with the SEC within two business days of any transaction. It includes:

    • The name of the insider (CEO, CFO, director, etc.).
    • The type of transaction (buy or sell).
    • The number of shares traded.
    • The price per share.
    • The insider’s remaining holdings after the transaction.

    These filings provide transparency and allow investors to monitor executives’ confidence in their own companies.

    2. Where to Find Insider Trading Data

    Several online resources aggregate insider trading information, making it easier for investors to track executive transactions:

    • Tradesk App – The insider trade tracking feature is now live on the Tradesk platform
    • SEC EDGAR Database  – The official source for all insider filings.
    • FINRA Insider Trading Reports – Reports on insider trading trends and regulatory oversight.
    • Market Data Platforms (Bloomberg, Reuters, Yahoo Finance, Finviz, and Tradesk’s research tools) – Provide consolidated insider trade data.

    These tools help investors quickly access and interpret insider trading activity without manually searching SEC filings.

    3. Key Metrics to Watch

    Not all insider transactions are meaningful. To distinguish valuable signals from noise, consider the following factors:

    • Large Insider Purchases: If an executive buys a substantial stake, it often signals strong confidence in future performance.
    • Consistent Buying Activity: Repeated insider purchases suggest a sustained belief in the company’s long-term success.
    • High-Ranking Executives: Trades by CEOs, CFOs, and board members are more informative than those by lower-level employees.
    • Cluster Buying: When multiple executives buy shares at the same time, it can indicate a broader consensus that the stock is undervalued.
    • Ratio of Buying vs. Selling: While selling can be due to personal financial reasons, a high ratio of buying over selling is a strong bullish indicator.

    Practical Applications for Everyday Investors
    This insider trading feature is designed to provide actionable insights for various investor types:

    • Growth Investors can help identify high conviction buys from company leaders, signaling growth opportunities.
    • Value Investors can help leverage insider data to spot undervalued companies where insiders are increasing their stakes.
    • Short-Term Traders can help monitor insider trades to capitalize on short-term market reactions, aligning with the timing of these moves.

    By making insider trade tracking accessible, Tradesk is shifting the dynamics of the market, leveling the playing field between retail investors and institutional players.

    How to Use Insider Trading Data in Your Investment Strategy

    1. Confirming Investment Decisions

    Investors can use insider trading data to validate their stock selections. If you’re considering buying a stock and notice that multiple insiders are also buying, it can reinforce your conviction.

    2. Spotting Undervalued Stocks

    Insider buying is often seen in stocks that executives believe are trading below their fair value. Monitoring such trades can help investors identify promising buying opportunities before the broader market recognizes them.

    3. Avoiding Overhyped Stocks

    If company insiders are aggressively selling their shares, it may indicate that the stock is overvalued or facing potential downturns. While insider selling isn’t always a red flag, a pattern of large sales can suggest caution.

    4. Timing Entry and Exit Points

    Tracking insider transactions can help investors fine-tune when to enter or exit a position. If a company sees an uptick in insider buying after a price dip, it may indicate a buying opportunity. Conversely, if insiders start selling after a prolonged rally, it could signal a potential correction.

    Additional Insights on Insider Trading

    1. Case Studies of Insider Trading Influence

    Real-world examples help illustrate the power of insider trading analysis. For example, Tesla’s stock surged in 2020 after Elon Musk made substantial insider purchases. Similarly, major insider selling before the collapse of Enron served as an early warning sign for investors.

    2. Using AI to Detect Insider Trading Trends

    Artificial intelligence is increasingly used to analyze insider transactions, identifying patterns and anomalies that human investors might miss. AI-driven platforms can flag unusual trading activity, helping traders act faster on emerging trends.

    3. Sector-Based Insider Trading Patterns

    Different industries have varying norms for insider trading. In the technology sector, insider buying is more common when launching innovative products, whereas in biotechnology, insiders may buy stock ahead of clinical trial results. Understanding sector-specific trends can enhance insider trading analysis.

    Conclusion

    Monitoring insider trading activity is a powerful tool that provides valuable insights into executive sentiment and company performance. By tracking Form 4 filings, analyzing transaction patterns, and distinguishing between meaningful trades and noise, investors can make more informed investment decisions.

    While insider trading data should not be the sole basis for making investment decisions, it can serve as a valuable confirmation tool when used alongside financial analysis and market trends.


    Want to track insider trading data more effectively? Explore Tradesk’s research tools for real-time insider trading insights and smarter investing decisions!

    insights and smarter investing decisions!

  • Your Edge with Data: Unlocking the Power of Tradesk’s Data Visualization Tools and Analytics

    Your Edge with Data: Unlocking the Power of Tradesk’s Data Visualization Tools and Analytics

    At Tradesk, we understand that traders need more than just raw data—they need actionable insights presented in a clear, interactive, and customizable format. Our data visualization and custom analytics tools are designed to help investors interpret complex market data efficiently, spot opportunities, and improve their trading strategies in a customizable, user-driven environment.

    Why Data Visualization Matters in Trading

    The financial markets generate vast amounts of data every second, from stock prices and volume trends to economic indicators and sentiment analysis. Making sense of this data manually is impossible, which is why data visualization is essential for modern traders.

    Key Benefits of Data Visualization in Trading:

    • Identifying Market Trends Quickly: Interactive charts allow traders to spot patterns and momentum shifts in real-time.
    • Reducing Information Overload: Instead of scanning hundreds of numerical data points, visual dashboards make insights easier to interpret.
    • Enhancing Technical Analysis: With custom indicators and overlays, traders can pinpoint best entry and exit points.
    • Personalized Data Views: Traders can customize dashboards to highlight the metrics most relevant to their strategy.
    • Faster Decision-Making: With real-time alerts and signals, traders can react quickly to market changes.
    • Improved Portfolio Management: Data visualization allows investors to see their holdings, risk exposure, and asset correlations in one place.

    1. Customizable Trading Dashboards

    Every trader has unique needs, which is why Tradesk offers fully customizable dashboards that offer real-time insights into stock movements, volume trends, and technical indicators.

    Features:

    • Drag-and-drop widgets for stock watchlists, charts, and news feeds.
    • Real-time price updates and historical trend analysis.
    • Personalized alerts based on user-defined thresholds.
    • Integrated news feeds to provide real-time updates on market-moving events.

    Use Case:

    • A day trader tracking high-volatility stocks can set up a dashboard showing real-time candlestick charts, moving averages, and RSI indicators to make quick buy/sell decisions.
    • A long-term investor can create a dashboard that highlights overall portfolio health, dividend tracking, and asset performance over time.

    2. Advanced Charting with Technical Indicators

    Tradesk provides an advanced charting suite that integrates with a vast library of technical indicators, making it easier to apply proven analysis techniques.

    Key Indicators Available:

    • Moving Averages (SMA, EMA): Identifies momentum trends.
    • Relative Strength Index (RSI): Measures overbought or oversold conditions.
    • Bollinger Bands: Helps predict price volatility.
    • MACD (Moving Average Convergence Divergence): Identifies trend reversals.
    • Fibonacci Retracement Levels: Helps identify support and resistance zones.
    • Volume Profile: Provides insight into price levels with the highest trading activity.

    Use Case:

    • A swing trader looking for potential breakouts can use MACD crossovers and Bollinger Bands to time entries and exit more effectively.
    • A technical analyst can overlay Fibonacci retracement levels to predict potential reversal points.

    3. AI-Powered Sentiment Analyses

    Tradesk’s AI-powered analytics scan financial news, earnings reports, and social media trends to gauge market sentiment in real time. This feature helps traders understand the emotional drivers behind price movements.

    Why It Matters:

    • Identifies bullish or bearish sentiment shifts before they reflect in stock prices.
    • Filters out market noise, highlighting only impactful news.
    • Gives traders an edge by aligning data-driven analysis with crowd psychology.
    • Uses natural language processing (NLP) to categorize financial news based on sentiment.

    Use Case:

    • Before an earnings report, a trader can check real-time sentiment indicators to see whether market sentiment is bullish or bearish, adjusting their strategy accordingly.
    • Investors can track sentiment trends over time to identify potential turning points in market psychology.

    4. Back testing & Strategy Optimization

    One of the biggest challenges traders faces is determining whether their strategies work. Tradesk’s back testing engine allows users to simulate trades using historical market data to refine strategies before putting real capital at risk.

    Features:

    • Test technical and fundamental strategies across different market conditions.
    • Analyze performance metrics such as win rate, risk/reward ratio, and drawdowns.
    • Optimize entry and exit points based on past market behavior.
    • Compare multiple strategies side by side to determine the best approach.

    Use Case:

    • A trader developing a momentum-based strategy can back test it is using five years of historical data to see if it performs well under varying market conditions before deploying it live.
    • A hedge fund manager can compare different hedging techniques against market downturns.

    5. Portfolio Analytics & Risk Management Tools

    Tradesk’s portfolio analytics tools help traders assess risk, track diversification, and optimize asset allocation. By visualizing portfolio performance metrics, investors can make informed decisions to enhance long-term returns.

    Features:

    • Asset allocation heatmaps to assess diversification.
    • Volatility tracking to measure risk exposure.
    • Correlation matrices to identify relationships between assets.
    • Stress testing tools to simulate portfolio performance under different market conditions.

    Use Case:

    • A long-term investor holding a diversified portfolio can use Tradesk’s risk management tools to ensure they are not overexposed to a single sector or asset class.
    • A trader can use volatility tracking tools to measure the risk level of specific stocks and adjust holdings accordingly.

    Conclusion

    Successful investing requires more than just intuition, it is about incorporating data and insight into a sound decision making process. Tradesk’s visualization and analytics tools are designed to support that effort by making market data easier to interpret, compare, and use within your investment approach.

    Whether you are analyzing technical trends, monitoring portfolio health, or running hypothetical back tests, Tradesk offers tools to help you better understand the markets and your strategy.


    Want to see how Tradesk’s data analytics tools can transform your trading strategy? Sign up today and start making smarter, data driven investment decisions!

  • Q2 Earnings Calendar: Key Dates, Market Insights, and  Trading Strategies

    Q2 Earnings Calendar: Key Dates, Market Insights, and Trading Strategies

    This guide highlights key Q2 earnings report dates, analyzes major trends, and explains how investors can use earnings data to refine their trading strategies.

    Why Q2 Earnings Matter

    Quarterly earnings reports provide transparency into a company’s financial health and strategic direction. The second quarter is particularly important as it captures back-to-school consumer trends, holiday preparation, and economic shifts leading into year-end. Many investors closely monitor Q2 earnings to gauge company performance before the critical holiday shopping season and year-end financial close.

    Macroeconomic Factors Affecting Q2 Earnings

    Several external factors can shape corporate earnings in Q2, influencing market sentiment and stock movements. Understanding these macroeconomic conditions can provide deeper insight into how different sectors will perform.

    • Interest Rates & Inflation – The Federal Reserve’s interest rate decisions directly impact corporate borrowing costs and consumer spending. If rates rise, companies with high debt levels may see increased costs, while lower rates could boost growth.
    • Global Trade & Supply Chain Issues – Disruptions in global supply chains can impact production and inventory levels, particularly for industries reliant on overseas manufacturing, such as electronics and automotive.
    • Consumer Spending Trends – Retailers and e-commerce platforms depend heavily on consumer confidence. Higher disposable income levels can lead to increased spending, whereas economic slowdowns may affect discretionary purchases.
    • Commodity Prices – Energy and raw material costs impact sectors like manufacturing, agriculture, and energy production. Rising oil prices can increase operating costs, while lower prices may improve corporate profit margins.

    Key Q2 Earnings Report Dates

    (All dates are tentative and subject to change.)

    Below is a breakdown of major companies reporting in Q2 2025, categorized by sector. These earnings reports will provide insight into each sector’s financial health and future prospects.

    Technology Sector

    The technology sector continues to dominate the stock market, with AI, cloud computing, and semiconductors playing a pivotal role. Investors will look for insights on revenue growth, software subscriptions, and advancements in AI-driven services.

    • Apple (AAPL) – July 25, 2025
    • Microsoft (MSFT) – July 23, 2025
    • Alphabet (GOOGL) – July 24, 2025
    • Amazon (AMZN) – July 25, 2025
    • NVIDIA (NVDA) – August 15, 2025

    Financial Sector

    Banking and financial institutions provide a gauge on overall economic health. Earnings from major banks will reveal trends in consumer lending, interest rate impacts, and investment performance.

    • JPMorgan Chase (JPM) – July 12, 2025
    • Goldman Sachs (GS) – July 15, 2025
    • Bank of America (BAC) – July 16, 2025
    • Morgan Stanley (MS) – July 17, 2025
    • Wells Fargo (WFC) – July 18, 2025

    Retail & Consumer Goods

    Retailers often see seasonal shifts in Q2, preparing for the holiday shopping season. Investors will analyze same-store sales, e-commerce growth, and changing consumer behavior.

    • Walmart (WMT) – August 6, 2025
    • Target (TGT) – August 7, 2025
    • Costco (COST) – August 10, 2025
    • Nike (NKE) – September 5, 2025
    • Home Depot (HD) – August 13, 2025

    Mid-Cap Growth Stocks to Watch

    While large-cap stocks dominate headlines, mid-cap companies present unique growth opportunities. These emerging stocks can deliver high returns but often carry greater volatility.

    • Roku (ROKU) – August 22, 2025
    • DraftKings (DKNG) – August 24, 2025
    • Palantir Technologies (PLTR) – August 25, 2025
    • Snowflake (SNOW) – August 30, 2025

    Market Trends & Earnings Expectations for Q2 2025

    1. Technology & AI Boom Continues

    AI-driven advancements remain a focal point for investors. Companies like NVIDIA, Microsoft, and Alphabet are expected to highlight new AI models and increased cloud computing demand.

    2. Retail Performance in a Slowing Economy

    Retailers will provide insights into consumer spending habits. If inflation continues to impact discretionary income, companies like Target and Walmart may adjust their pricing strategies to attract cost-conscious consumers.

    3. Energy Prices & Oil Market Volatility

    Energy companies’ earnings will depend on oil price fluctuations. Major players like ExxonMobil and Chevron will report on energy demand, production output, and geopolitical risks.

    Trading Strategies for Q2 Earnings Season

    1. Pre-Earnings Positioning

    • Review historical earnings trends and analyst expectations.
    • Identify stocks with consistent earnings beats that may rally post-announcement.
    • Analyze implied volatility in options to determine market sentiment before earnings.

    2. Post-Earnings Momentum Trading

    • Stocks that exceed earnings expectations often see post-report price surges.
    • Monitor stocks that miss estimates but still show strong long-term fundamentals for potential dips to buy.
    • Track post-earnings gap movements to identify possible entry points.

    3. Options Strategies for Earnings Reports

    • Straddle or Strangle Trades: Capitalize on high volatility by using options strategies that benefit from large price swings.
    • Covered Calls or Protective Puts: Hedge positions against unexpected earnings reactions.

    4. Sector Rotation & ETF Plays

    • If a specific sector shows strength (e.g., tech or healthcare), investors may shift holdings into sector-based ETFs like QQQ (Nasdaq-100) or XLV (Healthcare ETF).

    5. AI-Powered Trading Insights

    Platforms such as Tradesk can surface historical earnings patterns and sentiment metrics in real time, helping traders react quickly to surprises. (Data and analytics provided “as is.” Accuracy not guaranteed.)

    Conclusion

    Q2 earnings season provides critical insights into corporate performance and economic trends. By staying informed about key earnings report dates and monitoring sector specific movements, traders and investors can position themselves strategically for market opportunities.

    Whether you are trading short-term earnings reactions or making long-term investment decisions, tracking earnings data is essential for maximizing portfolio performance.


    Want to stay ahead of Q2 earnings? Follow Tradesk’s market insights and analytics tools for real-time updates on earnings trends, stock movements, and trading opportunities!