Category: Tools and Technology

  • Stay Ahead with Insider Trades: How to Monitor Insider Trading Activity for Smarter Investing

    Stay Ahead with Insider Trades: How to Monitor Insider Trading Activity for Smarter Investing

    When top executives and key stakeholders buy or sell shares of their own company, it can provide valuable clues about the company’s financial health and future prospects. Insider trading activity the buying and selling of stock by corporate executives, board members, and key employees—often reflects confidence or concern about a company’s future performance.

    By tracking insider transactions, investors can gain an edge in understanding stock movements and refining their strategies.

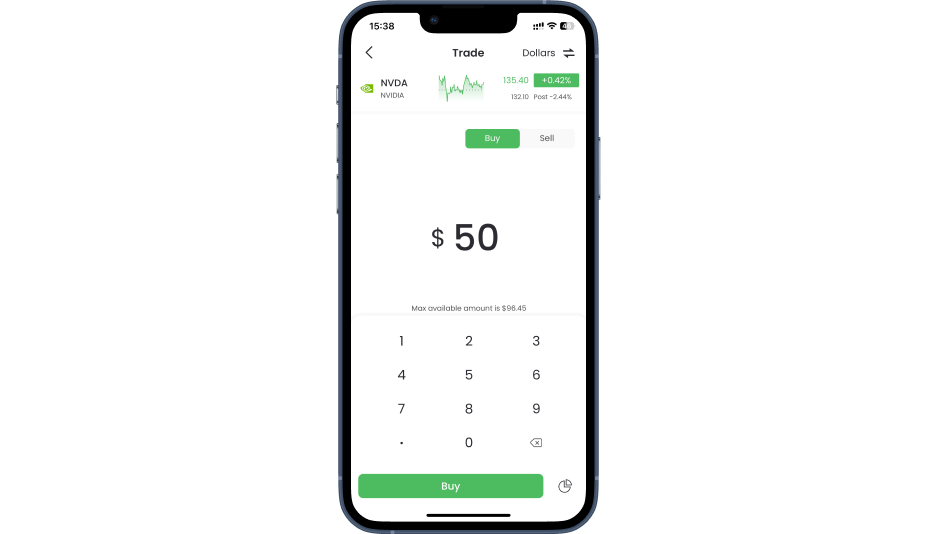
    Tradesk now makes this easier than ever. Our platform’s built in Insider Trades feature gives investors a real time, visual breakdown of executive transactions so you can act on what the market’s decision makers are doing, not just what they’re saying.

    By tracking insider transactions, investors can gain an edge in understanding stock movements and refining their investment strategies. This guide will explain what insider trading is, how to track it, and how to use this information to make smarter investment decisions.

    What is Insider Trading?

    Legal vs. Illegal Insider Trading

    Insider trading refers to the buying or selling of stocks by company insiders. There are two types:

    • Legal Insider Trading: When corporate executives and employees buy or sell stock while properly reporting their transactions to regulatory agencies, such as the SEC.
    • Illegal Insider Trading: When insiders trade stocks based on material nonpublic information (such as upcoming earnings reports, mergers, or regulatory approvals) before it is disclosed to the public.

    Understanding the difference is crucial, as illegal insider trading carries severe penalties, while legal insider trading can provide valuable insights for investors.

    Why Insider Trades Matter to Investors

    Executives and directors have deep knowledge of their company’s financial health and future prospects. Their buying and selling activity can serve as a signal for investors:

    • Insider Buying: Often suggests confidence in the company’s future growth or undervaluation.
    • Insider Selling: Could indicate concerns about the company’s stock price, upcoming challenges, or an overvalued market position.

    It’s important to analyze these trades in context, as some executives may sell shares for personal financial reasons unrelated to the company’s outlook.

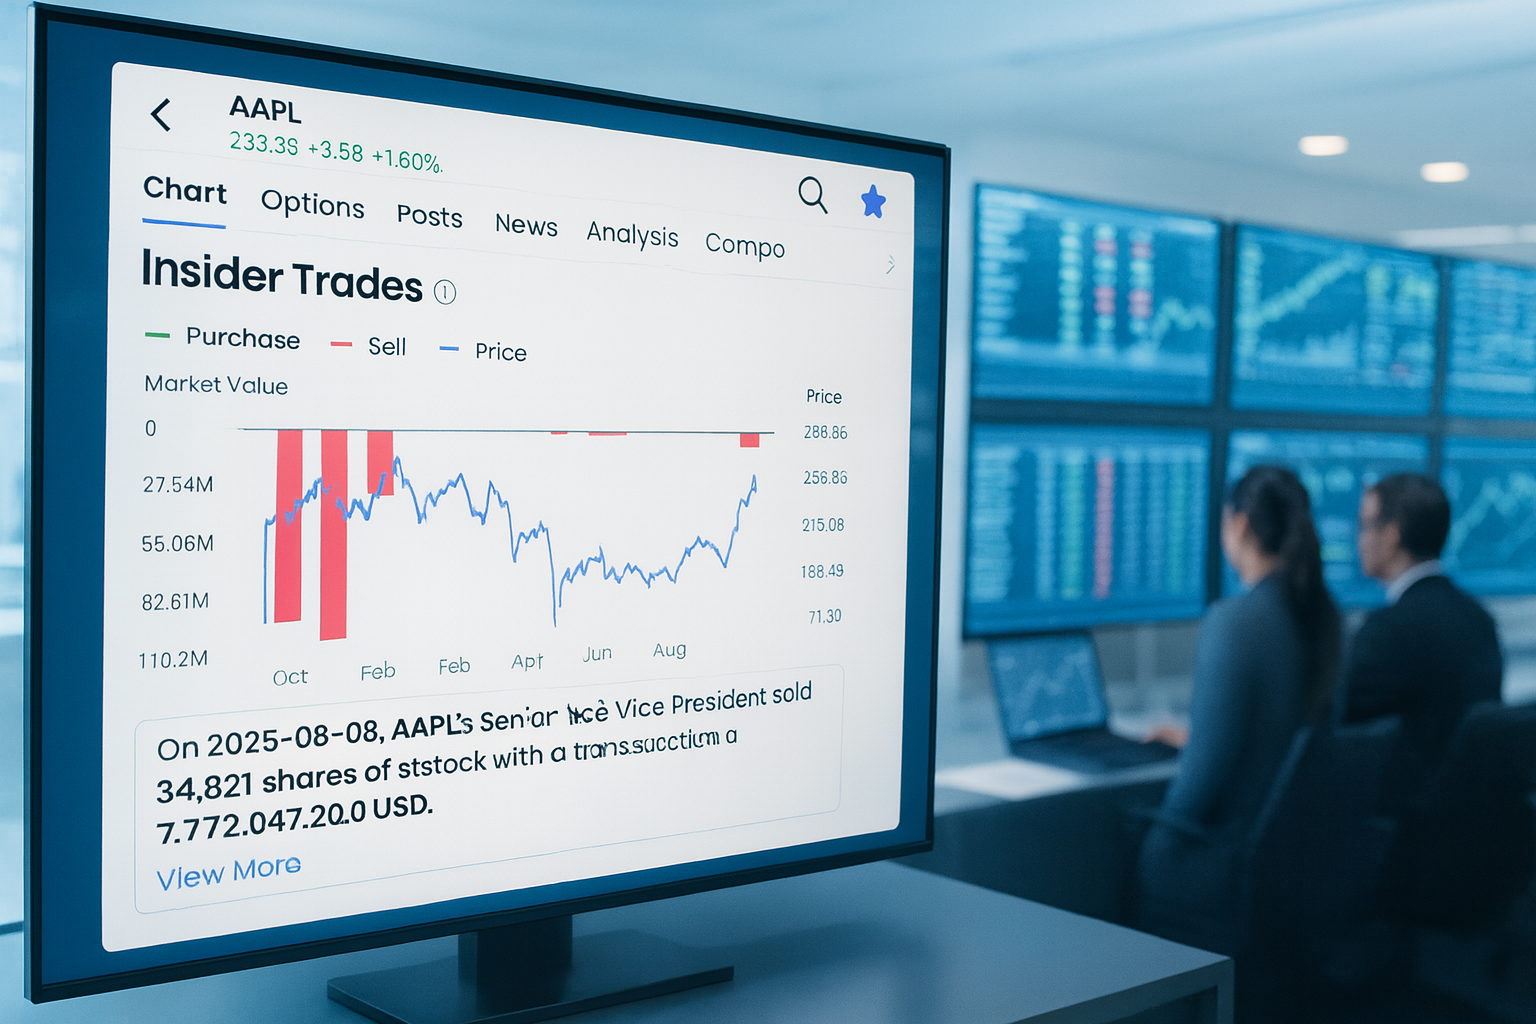
    How Real Time Insider Trade Tracking Works
    With Tradesk’s insider trade tracking, users can view trades to track specific companies, industries, or individual executives. The tool presents clear visualizations of insider activity, allowing users to spot trends, analyze patterns, and integrate this data into their market strategy. By observing what executives and board members are doing with their own shares, investors gain insights into a company’s potential trajectory, often months before results become publicly apparent.

    How to Track Insider Trading Activity

    Investors can monitor insider trades through publicly available data. In the U.S., the Securities and Exchange Commission (SEC) requires insiders to report trades via Form 4 filings.

    1. Understanding SEC Form 4 Filings

    Form 4 is a document that insiders must file with the SEC within two business days of any transaction. It includes:

    • The name of the insider (CEO, CFO, director, etc.).
    • The type of transaction (buy or sell).
    • The number of shares traded.
    • The price per share.
    • The insider’s remaining holdings after the transaction.

    These filings provide transparency and allow investors to monitor executives’ confidence in their own companies.

    2. Where to Find Insider Trading Data

    Several online resources aggregate insider trading information, making it easier for investors to track executive transactions:

    • Tradesk App – The insider trade tracking feature is now live on the Tradesk platform
    • SEC EDGAR Database  – The official source for all insider filings.
    • FINRA Insider Trading Reports – Reports on insider trading trends and regulatory oversight.
    • Market Data Platforms (Bloomberg, Reuters, Yahoo Finance, Finviz, and Tradesk’s research tools) – Provide consolidated insider trade data.

    These tools help investors quickly access and interpret insider trading activity without manually searching SEC filings.

    3. Key Metrics to Watch

    Not all insider transactions are meaningful. To distinguish valuable signals from noise, consider the following factors:

    • Large Insider Purchases: If an executive buys a substantial stake, it often signals strong confidence in future performance.
    • Consistent Buying Activity: Repeated insider purchases suggest a sustained belief in the company’s long-term success.
    • High-Ranking Executives: Trades by CEOs, CFOs, and board members are more informative than those by lower-level employees.
    • Cluster Buying: When multiple executives buy shares at the same time, it can indicate a broader consensus that the stock is undervalued.
    • Ratio of Buying vs. Selling: While selling can be due to personal financial reasons, a high ratio of buying over selling is a strong bullish indicator.

    Practical Applications for Everyday Investors
    This insider trading feature is designed to provide actionable insights for various investor types:

    • Growth Investors can help identify high conviction buys from company leaders, signaling growth opportunities.
    • Value Investors can help leverage insider data to spot undervalued companies where insiders are increasing their stakes.
    • Short-Term Traders can help monitor insider trades to capitalize on short-term market reactions, aligning with the timing of these moves.

    By making insider trade tracking accessible, Tradesk is shifting the dynamics of the market, leveling the playing field between retail investors and institutional players.

    How to Use Insider Trading Data in Your Investment Strategy

    1. Confirming Investment Decisions

    Investors can use insider trading data to validate their stock selections. If you’re considering buying a stock and notice that multiple insiders are also buying, it can reinforce your conviction.

    2. Spotting Undervalued Stocks

    Insider buying is often seen in stocks that executives believe are trading below their fair value. Monitoring such trades can help investors identify promising buying opportunities before the broader market recognizes them.

    3. Avoiding Overhyped Stocks

    If company insiders are aggressively selling their shares, it may indicate that the stock is overvalued or facing potential downturns. While insider selling isn’t always a red flag, a pattern of large sales can suggest caution.

    4. Timing Entry and Exit Points

    Tracking insider transactions can help investors fine-tune when to enter or exit a position. If a company sees an uptick in insider buying after a price dip, it may indicate a buying opportunity. Conversely, if insiders start selling after a prolonged rally, it could signal a potential correction.

    Additional Insights on Insider Trading

    1. Case Studies of Insider Trading Influence

    Real-world examples help illustrate the power of insider trading analysis. For example, Tesla’s stock surged in 2020 after Elon Musk made substantial insider purchases. Similarly, major insider selling before the collapse of Enron served as an early warning sign for investors.

    2. Using AI to Detect Insider Trading Trends

    Artificial intelligence is increasingly used to analyze insider transactions, identifying patterns and anomalies that human investors might miss. AI-driven platforms can flag unusual trading activity, helping traders act faster on emerging trends.

    3. Sector-Based Insider Trading Patterns

    Different industries have varying norms for insider trading. In the technology sector, insider buying is more common when launching innovative products, whereas in biotechnology, insiders may buy stock ahead of clinical trial results. Understanding sector-specific trends can enhance insider trading analysis.

    Conclusion

    Monitoring insider trading activity is a powerful tool that provides valuable insights into executive sentiment and company performance. By tracking Form 4 filings, analyzing transaction patterns, and distinguishing between meaningful trades and noise, investors can make more informed investment decisions.

    While insider trading data should not be the sole basis for making investment decisions, it can serve as a valuable confirmation tool when used alongside financial analysis and market trends.


    Want to track insider trading data more effectively? Explore Tradesk’s research tools for real-time insider trading insights and smarter investing decisions!

    insights and smarter investing decisions!

  • Your Edge with Data: Unlocking the Power of Tradesk’s Data Visualization Tools and Analytics

    Your Edge with Data: Unlocking the Power of Tradesk’s Data Visualization Tools and Analytics

    At Tradesk, we understand that traders need more than just raw data—they need actionable insights presented in a clear, interactive, and customizable format. Our data visualization and custom analytics tools are designed to help investors interpret complex market data efficiently, spot opportunities, and improve their trading strategies in a customizable, user-driven environment.

    Why Data Visualization Matters in Trading

    The financial markets generate vast amounts of data every second, from stock prices and volume trends to economic indicators and sentiment analysis. Making sense of this data manually is impossible, which is why data visualization is essential for modern traders.

    Key Benefits of Data Visualization in Trading:

    • Identifying Market Trends Quickly: Interactive charts allow traders to spot patterns and momentum shifts in real-time.
    • Reducing Information Overload: Instead of scanning hundreds of numerical data points, visual dashboards make insights easier to interpret.
    • Enhancing Technical Analysis: With custom indicators and overlays, traders can pinpoint best entry and exit points.
    • Personalized Data Views: Traders can customize dashboards to highlight the metrics most relevant to their strategy.
    • Faster Decision-Making: With real-time alerts and signals, traders can react quickly to market changes.
    • Improved Portfolio Management: Data visualization allows investors to see their holdings, risk exposure, and asset correlations in one place.

    1. Customizable Trading Dashboards

    Every trader has unique needs, which is why Tradesk offers fully customizable dashboards that offer real-time insights into stock movements, volume trends, and technical indicators.

    Features:

    • Drag-and-drop widgets for stock watchlists, charts, and news feeds.
    • Real-time price updates and historical trend analysis.
    • Personalized alerts based on user-defined thresholds.
    • Integrated news feeds to provide real-time updates on market-moving events.

    Use Case:

    • A day trader tracking high-volatility stocks can set up a dashboard showing real-time candlestick charts, moving averages, and RSI indicators to make quick buy/sell decisions.
    • A long-term investor can create a dashboard that highlights overall portfolio health, dividend tracking, and asset performance over time.

    2. Advanced Charting with Technical Indicators

    Tradesk provides an advanced charting suite that integrates with a vast library of technical indicators, making it easier to apply proven analysis techniques.

    Key Indicators Available:

    • Moving Averages (SMA, EMA): Identifies momentum trends.
    • Relative Strength Index (RSI): Measures overbought or oversold conditions.
    • Bollinger Bands: Helps predict price volatility.
    • MACD (Moving Average Convergence Divergence): Identifies trend reversals.
    • Fibonacci Retracement Levels: Helps identify support and resistance zones.
    • Volume Profile: Provides insight into price levels with the highest trading activity.

    Use Case:

    • A swing trader looking for potential breakouts can use MACD crossovers and Bollinger Bands to time entries and exit more effectively.
    • A technical analyst can overlay Fibonacci retracement levels to predict potential reversal points.

    3. AI-Powered Sentiment Analyses

    Tradesk’s AI-powered analytics scan financial news, earnings reports, and social media trends to gauge market sentiment in real time. This feature helps traders understand the emotional drivers behind price movements.

    Why It Matters:

    • Identifies bullish or bearish sentiment shifts before they reflect in stock prices.
    • Filters out market noise, highlighting only impactful news.
    • Gives traders an edge by aligning data-driven analysis with crowd psychology.
    • Uses natural language processing (NLP) to categorize financial news based on sentiment.

    Use Case:

    • Before an earnings report, a trader can check real-time sentiment indicators to see whether market sentiment is bullish or bearish, adjusting their strategy accordingly.
    • Investors can track sentiment trends over time to identify potential turning points in market psychology.

    4. Back testing & Strategy Optimization

    One of the biggest challenges traders faces is determining whether their strategies work. Tradesk’s back testing engine allows users to simulate trades using historical market data to refine strategies before putting real capital at risk.

    Features:

    • Test technical and fundamental strategies across different market conditions.
    • Analyze performance metrics such as win rate, risk/reward ratio, and drawdowns.
    • Optimize entry and exit points based on past market behavior.
    • Compare multiple strategies side by side to determine the best approach.

    Use Case:

    • A trader developing a momentum-based strategy can back test it is using five years of historical data to see if it performs well under varying market conditions before deploying it live.
    • A hedge fund manager can compare different hedging techniques against market downturns.

    5. Portfolio Analytics & Risk Management Tools

    Tradesk’s portfolio analytics tools help traders assess risk, track diversification, and optimize asset allocation. By visualizing portfolio performance metrics, investors can make informed decisions to enhance long-term returns.

    Features:

    • Asset allocation heatmaps to assess diversification.
    • Volatility tracking to measure risk exposure.
    • Correlation matrices to identify relationships between assets.
    • Stress testing tools to simulate portfolio performance under different market conditions.

    Use Case:

    • A long-term investor holding a diversified portfolio can use Tradesk’s risk management tools to ensure they are not overexposed to a single sector or asset class.
    • A trader can use volatility tracking tools to measure the risk level of specific stocks and adjust holdings accordingly.

    Conclusion

    Successful investing requires more than just intuition, it is about incorporating data and insight into a sound decision making process. Tradesk’s visualization and analytics tools are designed to support that effort by making market data easier to interpret, compare, and use within your investment approach.

    Whether you are analyzing technical trends, monitoring portfolio health, or running hypothetical back tests, Tradesk offers tools to help you better understand the markets and your strategy.


    Want to see how Tradesk’s data analytics tools can transform your trading strategy? Sign up today and start making smarter, data driven investment decisions!

  • Mastering Tradesk: A Step-by-Step Guide for New Investors

    Mastering Tradesk: A Step-by-Step Guide for New Investors

    In this guide, we’ll walk you through everything you need to know about using Tradesk as a new investor—from setting up your account to making your first investment.


    Why Choose Tradesk?

    Tradesk offers a user-friendly platform tailored to beginners, with features that:

    • Simplify portfolio management.
    • Provide educational resources for informed decisions.
    • Automate processes like recurring investments and rebalancing.
    • Offer real-time insights to help you stay updated on market trends.

    Step 1: Setting Up Your Account

    1. Create Your Profile
      • Visit www.tradesk.co and click “Sign Up.”
      • Provide basic information like your name, email, and financial goals.
    2. Verify Your Identity
      • Submit identification documents as required for regulatory compliance.
    3. Link Your Bank Account
      • Connect your bank for deposits and withdrawals.

    Step 2: Define Your Investment Goals

    Before making your first trade, take some time to define your financial goals. Tradesk can help you set and track:

    • Short-Term Goals: Such as building an emergency fund or saving for a vacation.
    • Long-Term Goals: Such as retirement planning or buying a home.
    • Tradesk Feature Highlight: Use the platform’s goal-setting tool to prioritize your objectives and monitor your progress.

    Step 3: Learn the Basics with Tradesk’s Resources

    Tradesk offers a robust library of educational content, including:

    • Investing 101 Guides: Perfect for beginners.
    • Market Insights: Articles on current trends and strategies.
    • Tip: Start with the “Beginner’s Hub” to build foundational knowledge.

    Step 4: Explore the Dashboard

    Tradesk’s dashboard is designed for simplicity and clarity. Here’s what you’ll find:

    • Portfolio Overview: A snapshot of your holdings and performance.
    • Market Watchlist: Track stocks, ETFs, and funds you’re interested in.
    • Insights Tab: Personalized recommendations based on your goals and risk tolerance.

    Step 5: Make Your First Investment

    1. Fund Your Account
      • Transfer money from your linked bank account.
    2. Choose Your Investment
      • Use Tradesk’s screener to find investments that align with your goals.
      • Choices  include
        • Stocks: For growth potential.
        • ETFs: For diversification and lower risk.
    3. Place Your Order
      • Select the asset, input the amount, and confirm your trade.
    • Tip: It may be beneficial to start with fractional shares if you’re investing small amounts.

    Step 6: Automate Your Investing

    Consistency is key to growing your portfolio. Tradesk makes automation easy with:

    • Recurring Investments: Set up automatic contributions on a weekly or monthly basis.
    • Dividend Reinvestment: Automatically reinvest dividends to accelerate growth.

    Step 7: Monitor and Adjust Your Portfolio

    1. Track Performance
      • Use the portfolio tracker to view your returns, allocation, and progress toward goals.
    2. Rebalance as Needed
      • Periodically adjust your holdings to maintain your target allocation.
    3. Stay Informed
      • Check the Insights tab for updates on market trends and opportunities.
    • Tradesk Feature Highlight: Get alerts when your portfolio drifts from your desired allocation or when new opportunities arise.

    Common Mistakes to Avoid

    1. Skipping Education
      • Take advantage of Tradesk’s educational resources to make confident decisions.
    2. Reacting to Short-Term Market Swings
      • Stick to your long-term plan and avoid emotional trading.
    3. Neglecting Rebalancing
      • Keep your portfolio aligned with your goals by rebalancing regularly.

    How Tradesk Empowers New Investors

    Tradesk is more than just a trading platform—it’s your partner in building wealth. Here’s how:

    • Beginner-Friendly Tools: Simplified dashboards and automation features make investing easy.
    • Personalized Guidance: AI-powered insights tailored to your goals and risk tolerance.
    • Comprehensive Support: Access tutorials, FAQs, and customer support to answer your questions.

    Conclusion

    Mastering Tradesk is your first step toward confident investing. By following this step-by-step guide, you’ll be ready to navigate the platform, set goals, and make smart investments. Whether you’re starting with $100 or planning for long-term growth, Tradesk has the tools to help you succeed.

    Ready to start your investing journey? Visit www.tradesk.co to create your account and take control of your financial future today.


    Discover how Tradesk can simplify investing for beginners. Sign up at www.tradesk.co and access tools designed to help you achieve your financial goals with confidence.