But don’t worry stock charts aren’t as complicated as they look! Once you understand the basics, you’ll be able to analyze price movements, identify trends, and make more informed investment decisions. This guide will walk you through the essential elements of a stock chart and help you start using charts to your advantage.
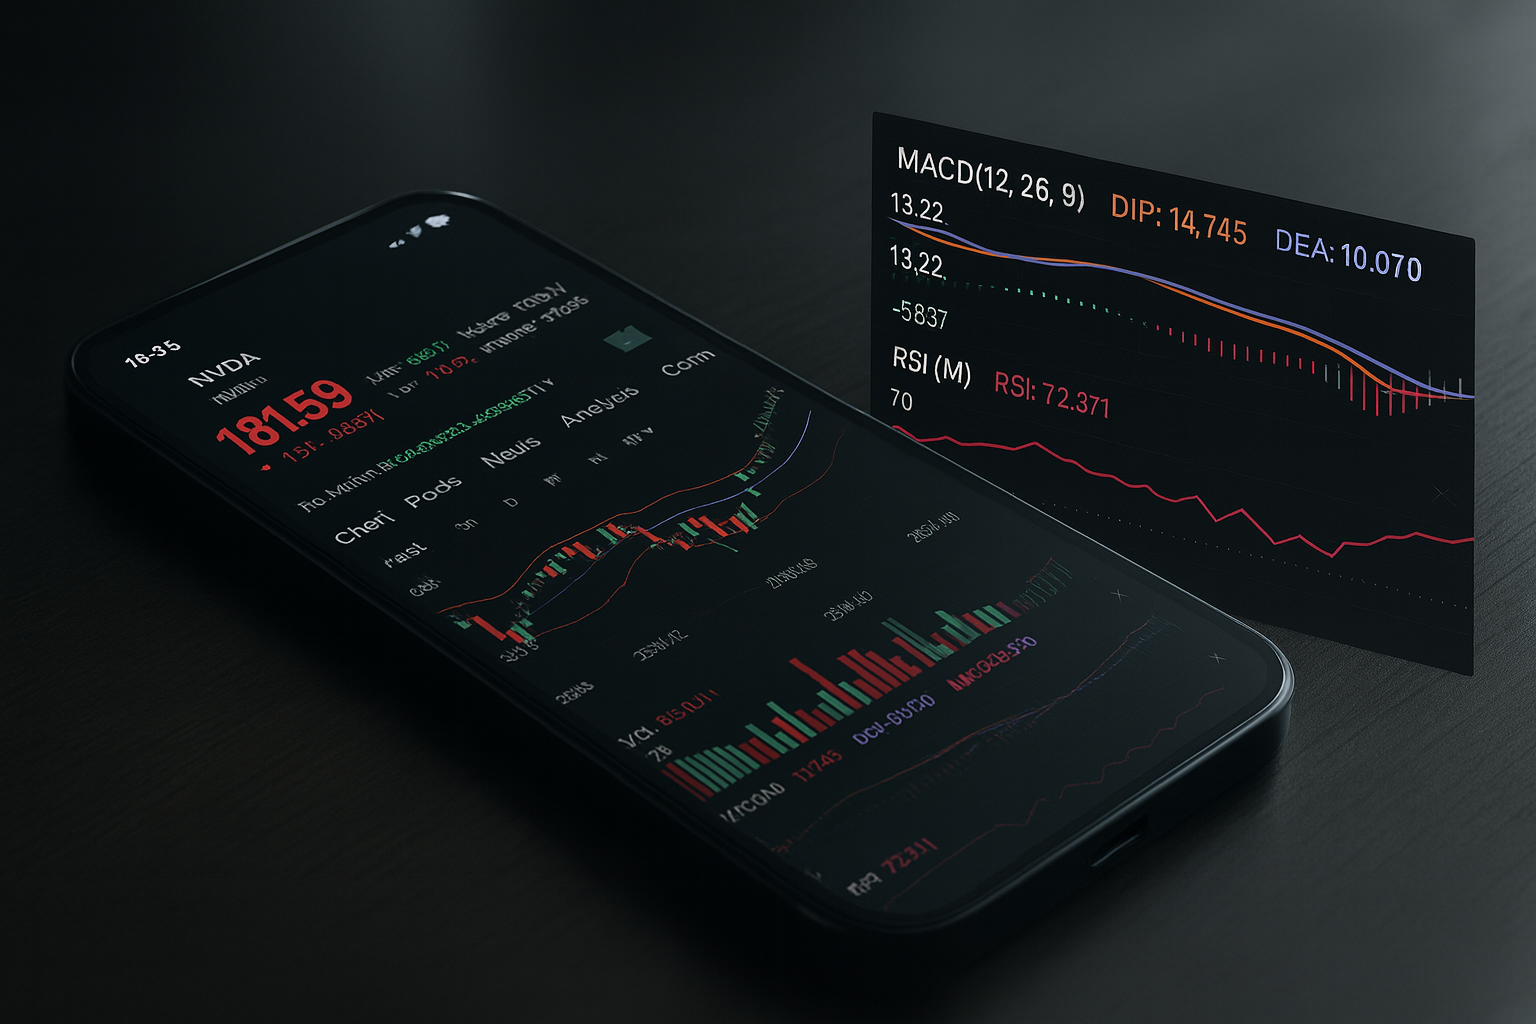
Tradesk’s advanced charting tools make it easy to visualize price trends, volume spikes, and technical indicators all in one seamless interface. Use this guide alongside the app to sharpen your skills.
What Is a Stock Chart?
A stock chart is a graphical representation of a stock’s price movements over a specific period. It allows traders and investors to analyze historical performance, spot trends, and predict potential future movements.
Why Are Stock Charts Important?
Stock charts serve as essential tools for investors and traders alike. They help market participants gauge stock performance, identify buy or sell opportunities, and recognize key price levels.
- Identify Trends – Charts help determine if a stock is in an uptrend, downtrend, or moving sideways.
- Understand Price Movements – Analyzing past price action can help predict future movements.
- Support Trading Decisions – Traders use stock charts to decide when to buy or sell based on price patterns and technical indicators.
- Evaluate Market Sentiment – Stock charts often reflect investor psychology, fear, and greed, which influence price action.
Key Components of a Stock Chart
1. Time Frame
Stock charts display price data over different time frames. Understanding these time frames is crucial because different investors and traders analyze charts based on their investment horizon.
- Intraday (1-minute, 5-minute, 15-minute) – Used for short-term trading and day traders looking for quick gains.
- Daily or Weekly – Common for swing traders and long-term investors analyzing medium-term trends.
- Monthly or Yearly – Helps investors assess long-term price action and identify macro trends in the stock’s performance.
2. Price Movements
Stock charts visually represent the fluctuation of stock prices over time. Price movements can be displayed using different types of charts:
- Line Chart – A simple chart that connects closing prices over time, useful for identifying overall trends.
- Bar Chart – Displays opening, closing, high, and low prices for each time period, providing more detail than line charts.
- Candlestick Chart – The most popular chart type, showing detailed price movements with green (up) and red (down) candlesticks. This chart type provides the most visual insights into stock price action.
3. Volume
- Volume represents the number of shares traded during a specific period. High volume typically indicates strong interest in a stock, while low volume may suggest weak market participation.
- A sudden increase in volume can signal a major price move, either up or down. Volume spikes are often associated with earnings releases, major news, or significant institutional buying and selling.
4. Support and Resistance Levels
- Support: A price level where a stock tends to stop falling and bounce back up due to buying pressure.
- Resistance: A price level where a stock struggles to rise above and often reverses downward due to selling pressure.
- Breakouts: When a stock moves above resistance or below support, it can indicate the start of a new trend.
Understanding support and resistance helps investors predict potential entry and exit points.
Advanced Stock Chart Analysis
1. Trendlines and Channels
Trendlines are straight lines drawn on a chart to connect price points. These lines help investors visually identify trends and potential reversal points.
- Uptrend Line: Drawn by connecting higher lows, indicating continued upward movement.
- Downtrend Line: Drawn by connecting lower highs, suggesting downward movement.
- Channels: Formed when two parallel trendlines contain price movement, helping traders predict breakouts.
2. Candlestick Patterns
Candlestick patterns provide insights into market sentiment and potential reversals. Some key patterns include:
- Doji: Indicates indecision in the market; can signal a trend reversal.
- Hammer and Hanging Man: Suggests potential reversals based on price rejections.
- Engulfing Patterns: Bullish or bearish reversals signaled by a larger candle engulfing a previous one.
- Morning Star and Evening Star: Three-candle reversal patterns signaling bullish or bearish momentum.
3. Fibonacci Retracement
Fibonacci retracement is a technical tool used to identify support and resistance levels based on mathematical ratios.
- Common retracement levels: 23.6%, 38.2%, 50%, 61.8%, and 78.6%.
- Helps traders anticipate potential reversal zones where a stock may bounce or consolidate.
Technical Indicators to Use With Stock Charts
1. Relative Strength Index (RSI)
RSI measures the strength of a stock’s price movement on a scale from 0 to 100.
- Above 70: The stock may be overbought (due for a pullback).
- Below 30: The stock may be oversold (potential buying opportunity).
2. Moving Average Convergence Divergence (MACD)
MACD is a momentum indicator that helps identify trend reversals.
- When the MACD line crosses above the signal line, it suggests a buy signal.
- When the MACD line crosses below the signal line, it suggests a sell signal.
3. Bollinger Bands
Bollinger Bands consist of three lines (upper, middle, and lower bands) that help identify volatility and potential price breakouts.
- Price near the upper band: Stock may be overbought.
- Price near the lower band: Stock may be oversold.
Conclusion
Reading stock charts is an essential skill for any investor. By understanding price movements, volume trends, and technical indicators, you can make informed trading decisions and better navigate the stock market.
For those looking to dive deeper into stock analysis, mastering advanced concepts such as trendlines, Fibonacci retracements, and candlestick patterns can further enhance trading accuracy.
If you’re ready to start analyzing stocks, explore Tradesk’s advanced charting tools and take control of your investing journey!
Looking for more investing insights? Check out our other beginner friendly guides on understanding market trends and how to place your first trade.